UPDATES
EAST PaC includes the 2015 national elections in Poland. Visit the Polish Social Data Archive.
Users have found and alerted us to some errors in EAST PaC that we report here.
To cite EAST PaC:
East European Parliamentarian and Candidate Data (EAST PaC), 1985 – 2015. Version 2.0. Funded by Poland’s National Science Centre (decision number 2012/05/E/HS6/03556).
The DOIs for the data are:
https://doi.org/10.18150/6JBD0H [EAST PaC 1985-2014]
https://doi.org/10.18150/LSBNLO [EAST PaC 1985-2015]
Below is a description of the first version of EAST PaC, archived in 2016.
——————–
This webpage describes the East European Parliamentarian and Candidate data (EAST PaC) for Ukraine, Poland, and Hungary. EAST PaC contains the near universe of candidates who ran for the national legislature in Poland, Hungary, and Ukraine and spans the 1990s to the 2010s (Polish data goes back to 1985). All told, EAST PaC covers three countries, 29 years, 23 elections, and 97,439 unique candidates. These data are freely and publicly available and are in the Polish Social Data Archive.
The main sources of these data are official records found in each country’s electoral commissions. Details on the methodology for EAST PaC – collecting, cleaning, and matching – are found in the book, Towards Electoral Control in Central and Eastern Europe.
Table 1 summarizes the sources and scope of EAST PaC data. While Hungary has only post-Communist elections, Polish data goes back to the Communist Party controlled elections of 1985. All told, EAST PaC covers three countries, 29 years, 23 elections, and 97,439 unique candidates.
Table 1. Summary of EAST PaC Data Ukraine, Poland, and Hungary
| Ukraine | Poland | Hungary | |
| House of Parliament | Verkhovna Rada | Sejm and Senat | Orszaggyules |
| Period covered | 1990-2014 | 1985-2011 | 1990-2010 |
| Number of elections | 8 | 9 | 6 |
| Number of unique candidates | 35,791 | 46,426 | 15,222 |
| Main source of data | Central Election Commission [Центральнa виборчa комісіa] | National Electoral Commission [Państwowa Komisja Wyborcza] | National Election office [Nyilvantarto es Valasztasi Hivatal] |
EAST PaC data are separated into each country: one for Ukraine, one for Poland, and one for Hungary. Table 2 is a visual representation of the elections in these countries of Central and Eastern Europe over time. Electoral volatility within the electoral systems led to special elections (Details on these elections are found later in the book, in Part Three: Context) Ukraine and Poland have had a few special elections, while Hungary has had only regular, four-year elections since their first post-Communist election held in 1990. Only in 1990, 1994, 1998, 2002, 2006 and 2007 do elections overlap across nations.
Table 2. Elections Covered in EAST PaC, 1985 – 2014
| Year | Ukraine | Poland | Hungary |
| 1985 | X | ||
| 1989 | X | ||
| 1990 | X | X | |
| 1991 | X | ||
| 1992 | |||
| 1993 | X | ||
| 1994 | X | X | |
| 1995 | |||
| 1996 | |||
| 1997 | X | ||
| 1998 | X | X | |
| 1999 | |||
| 2000 | |||
| 2001 | X | ||
| 2002 | X | X | |
| 2003 | |||
| 2004 | |||
| 2005 | X | ||
| 2006 | X | X | |
| 2007 | X | X | |
| 2008 | |||
| 2009 | |||
| 2010 | X | ||
| 2011 | X | ||
| 2012 | X | ||
| 2013 | |||
| 2014 | X |
The structure of EAST PaC is similar to that of panel data. These data are matched over time, meaning that the same candidate can be identified whenever they appear across successive elections. Table 3 is a visual representation of the structure of these data; it is the same structure across all EAST PaC data files. As a simple illustration, for “Country Z,” we present three generic candidates: A, B and C. Variables are specific for each election year. For example, Variable Y 1990 applies only to the 1990 election, and not to the elections of 1994 and 1998. Variable Y 1994 applies only to the 1994 election, and not to the elections of 1990 or 1998. In this illustration, the letter X represents the value of the variable; “missing” indicates no value for that variable.
In Country Z:
Candidate A ran for office only once, in 1994. The have a value in Variable Y 1994, and have missing values in the variables for the other election years.
Candidate B ran for office every year: 1990, 1994, and 1998. They have values in all variables: Variable Y 1990, Variable Y 1994, and Variable Y 1998.
Candidate C was a candidate in 1990. But in 1994, this person did not run for office and thus was not a candidate that election year. This person re-emerged as a candidate in 1998. They have values only in Variable Y 1990 and Variable Y 1998, the years in which they appear as a candidate.
Table 3. Generic Structure of EAST PaC Data
| Unique Candidate ID | Variable Y 1990 | Variable Y 1994 | Variable Y 1998 |
| Candidate A | missing | X | missing |
| Candidate B | X | X | X |
| Candidate C | X | missing | X |
In each election year, for each country, there is a different configuration of candidates. Table 4 presents the number of candidates per country and per election year. As discussed in Table 3, some candidates appear in multiple elections; thus, the total number of unique candidates cannot be computed from this table.
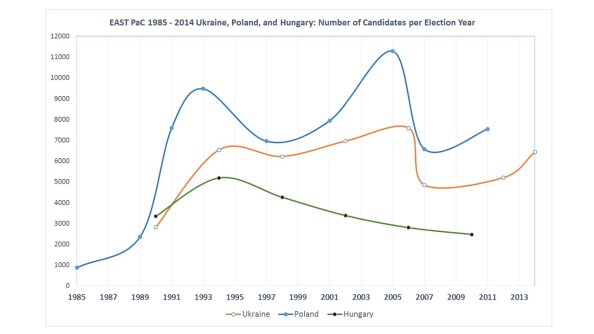 Table 4. Candidates per Election Year in the Countries of EAST PaC
| Election Year | Ukraine | Poland | Hungary |
| 1985 | 867 | ||
| 1989 | 2352 | ||
| 1990 | 2815 | 3340 | |
| 1991 | 7592 | ||
| 1993 | 9471 | ||
| 1994 | 6536 | 5187 | |
| 1997 | 6953 | ||
| 1998 | 6219 | 4256 | |
| 2001 | 7937 | ||
| 2002 | 6954 | 3378 | |
| 2005 | 11281 | ||
| 2006 | 7588 | 2795 | |
| 2007 | 4848 | 6572 | |
| 2010 | 2471 | ||
| 2011 | 7535 | ||
| 2012 | 5201 | ||
| 2014 | 6432 |
Available Variables
EAST PaC relies on official sources and thus has a limited array of variables that varies by country and election year. Table 5 presents the demographic variables available for each EAST PaC country. Name, year of birth, and gender are consistently available across all countries and all elections. Occupation is available in raw form for the 2006 – 2014 elections in Ukraine, and for Poland it is available in various forms between 1989 and 2011, and in Hungary, occupation is not available at all. Education is available only in Ukraine and from 1994 to 2014.
Table 5. Demographic Variables in EAST PaC, 1985 – 2014
| Variable | Ukraine
(1990 – 2014) |
Poland
(1985 – 2011) |
Hungary
(1990 – 2010) |
| Full Name | ALL | ALL | ALL |
| Year of Birth/Age | ALL | ALL | ALLa |
| Gender | ALL | ALL | ALL |
| Occupation | 2006 – 2012b | 1989 – 2011 | None |
| Education | 1994 – 2014 | None | None |
ALL = all elections; [Year] = election years in which these variables are available.
a In 2010, there is a relatively high percent of missing values on the variable, Year of Birth. For an explanation, see Chapter Six, this book.
b These data are available in raw form, upon request. They are not archived along with the rest of the data.
Electoral Characteristics
Electoral variables vary across elections, but there are some core variables that each country has (Table 6). Party and district are available across all countries and elections. Votes received (except for Poland in the 1980s) and whether the candidate was elected is also generally available. However, list position is only available in Ukraine from 1998 and in Poland from 1991 and in Hungary only in 2010.
Table 6. Electoral Variables in East PaC, 1985 – 2014
| Variable | Ukraine
(1990 – 2014) |
Poland
(1985 – 2011) |
Hungary
(1990 – 2010) |
| Party | ALL | ALL | ALL |
| District | ALL | ALL | ALL |
| List Position | 1998 – 2014 | 1991 – 2011 | 2010 |
| Votes Received | ALL | 1991 – 2011 | ALL |
| Elected or Not | ALL | ALL | ALL |
ALL = all elections; [Year] = election years in which these variables are available.
Electoral rules change and thus EAST PaC contains electoral variables that are specific for each country and each election. The array of such special variables for Ukraine and Poland are below (Tables 7 and 8). For Hungary, see the book, Appendix Two.
Table 7. Variables in EAST PaC Unique to Ukraine per Election Year, 1990 – 2014
| Election Year | Variables Unique to Ukraine per Election Year |
| 1990 | Okrug, Oblast, number of votes received in the first round, won first round, elected for the second round, number of votes received in the second round, won second round |
| 1994 | Okrug, Oblast, number of votes received in the first round, won first round, elected for the second round, number of votes received in the second round, won second round, was a candidate in additional elections, number of votes received in the additional elections, won first round of additional elections, elected to the second round of additional elections, number of votes received in the second round of additional elections, won second round of additional elections, new district if assigned for additional elections |
| 1998 | Okrug districts for majoritarian candidates, oblast for districts, blocks for elections, candidates by majoritarian system, candidates by party lists, candidates by both, party lists and majoritarian system, votes by majoritarian system, won by party list or majoritarian system |
| 2002 | Okrug districts for party candidates from which they campaign, oblast for these districts, oblast that candidate actually lives in, majoritarian or party candidate, blocks for elections |
| 2006 | Okrug districts for party candidates from which they campaign, oblast for these districts, oblast that candidate actually lives in, blocks for elections |
| 2007 | Oblast that candidate actually lives in, blocks for elections |
| 2012 | Okrug districts for party candidates from which they campaign, oblast for these districts, oblast that candidate actually lives in, majoritarian or party candidate |
| 2014 | Okrug districts for party candidates from which they campaign, oblast for these districts, oblast that candidate actually lives in, majoritarian or party candidate |
Table 8. Variables in EAST PaC Unique to Poland per Election Year, 1985 – 2011
| Election Year | Variables Unique to Poland per Election Year |
| 1985 | Limited to the Sejm and only contains age, gender, type of electoral list (district or national), and electoral district |
| 1989 | Data for Sejm and Senat, and has the same as 1991 to 2011, except it has type of electoral list (coded same as in 1985) and does not have list position or party affiliation |
| 1991 | For the Sejm: Type of electoral list, regular or supplementary elections |
| 1993 | For the Sejm: Type of electoral list, regular or supplementary elections, party affiliation and party electoral list |
| 1997 | For the Sejm: name of party committee, name of party affiliation/membership, and party electoral list |
| 2001 | For the Senat: Party affiliation and party electoral list |
| 2005 | Nothing unique for this election year |
| 2007 | Nothing unique for this election year |
| 2011 | Place of residence (name of village/town). For Senat: Electoral one-seat constituencies and Electoral committee. |
